Integration
xr-scipy wraps some of scipy.integrate functions.
Let’s create a simple example DataArray:
In [1]: arr = xr.DataArray(np.sin(np.linspace(0, 6.28, 30)) ** 2,
   ...:                    dims=('x'), coords={'x': np.linspace(0, 5, 30)})
   ...:

In [2]: arr
Out[2]:
<xarray.DataArray (x: 30)> Size: 240B
array([0.00000000e+00, 4.61661813e-02, 1.76139460e-01, 3.65918356e-01,
       5.80457402e-01, 7.80138804e-01, 9.28088451e-01, 9.96985262e-01,
       9.74106426e-01, 8.63676857e-01, 6.86089001e-01, 4.74137072e-01,
       2.66961112e-01, 1.02819215e-01, 1.20225984e-02, 1.13381944e-02,
       1.00892388e-01, 2.64147680e-01, 4.70956575e-01, 6.83128766e-01,
       8.61483534e-01, 9.73085045e-01, 9.97324436e-01, 9.29725546e-01,
       7.82771507e-01, 5.83599545e-01, 3.68989697e-01, 1.78572829e-01,
       4.75122222e-02, 1.01461475e-05])
Coordinates:
  * x        (x) float64 240B 0.0 0.1724 0.3448 0.5172 ... 4.483 4.655 4.828 5.0
Our integration function takes an xarray object and coordinate name along which the array to be integrated. The return type is also a DataArray,
# trapz computes definite integration
In [3]: xrscipy.integrate.trapezoid(arr, coord='x')
Out[3]:
<xarray.DataArray ()> Size: 8B
array(2.50124814)
# cumurative integration returns a same shaped array
In [4]: integ = xrscipy.integrate.cumulative_trapezoid(arr, 'x')
In [5]: integ
Out[5]:
<xarray.DataArray (x: 30)> Size: 240B
array([0. , 0.00397984, 0.02314412, 0.06987324, 0.15145736,
0.26875014, 0.41601111, 0.58196574, 0.75188744, 0.91031703,
1.04391753, 1.14393702, 1.2078248 , 1.23970241, 1.24960257,
1.25161643, 1.26129148, 1.29276045, 1.35613151, 1.45562162,
1.58877786, 1.74693032, 1.91679321, 2.08291821, 2.23054726,
2.34833787, 2.43045763, 2.4776613 , 2.49715139, 2.50124814])
Coordinates:
* x (x) float64 240B 0.0 0.1724 0.3448 0.5172 ... 4.483 4.655 4.828 5.0
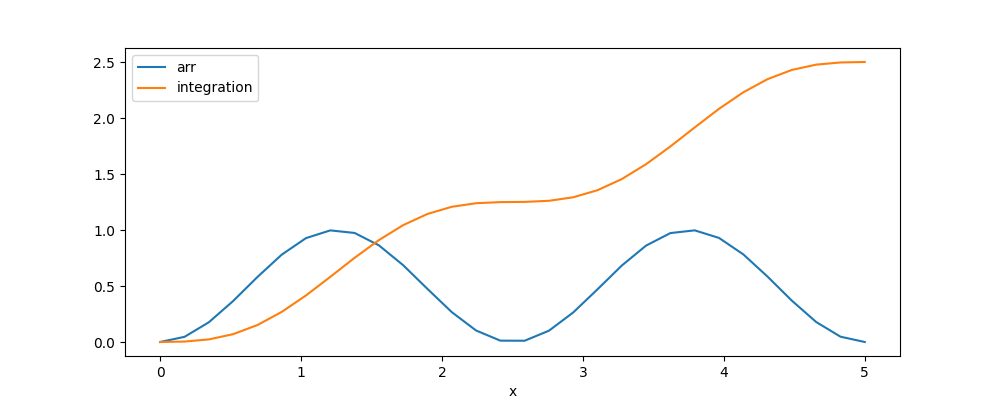
In [6]: arr.plot(label='arr')
Out[6]: [<matplotlib.lines.Line2D at 0x787d77666ad0>]
In [7]: integ.plot(label='integration')
Out[7]: [<matplotlib.lines.Line2D at 0x787d937a1d10>]
In [8]: plt.legend()
Out[8]: <matplotlib.legend.Legend at 0x787d937a2350>
In [9]: plt.show()
See trapezoid() for other options.
Note
There are slight difference from the original implementations.
Our cumulative_trapezoid() always assume initial=0.